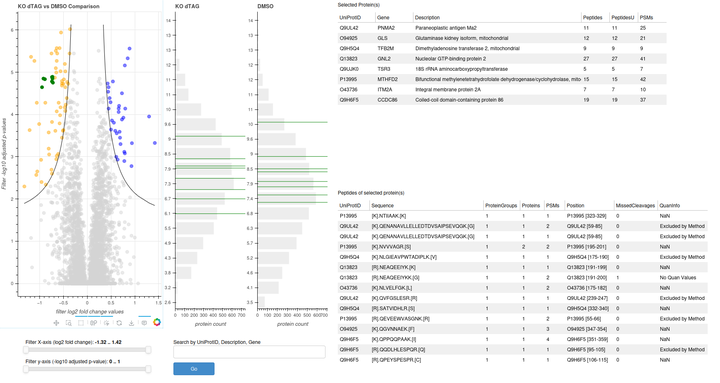
Shanti is a Python library for creating interactive, standalone HTML dashboards from proteomics data (specifically tabular data in Excel format). This package simplifies the process of creating volcano plots and histograms. This tool uses Bokeh library in the background to generate a HTML file that contains interactive plots and tables. The HTML files can be opened in a browser (Firefox, Chrome, Safari, Edge) and shared with colleagues. Your colleagues can explore proteomics data with without requiring any server or software installation. This tool is suitable for proteomics core facilities like Molecular Discovery Platform to report results to customers. This developed by Nara Marella at Center for Molecular Medicine of Austrian Academy of Sciences.
Visit demo HTML dashboard, user guide and python library in PyPi
Cite: Marella, N. (2025). Shanti: create SHarable, interactive, stANdalone html dashboard from Tabular proteomIcs data (v0.1.1). Zenodo. doi.org/10.5281/zenodo.15307776