1. Introduction
Transcriptional interference is a gene regulatory mechanism that takes place during RNA polymerase 1) binding and 2) movement along DNA. In tandem/convergent arrangement of (two or more) promoters, polymerase binding (and movement) at first promoter is shown to effect polymerase binding (and movement) at the second promoter [1]. In other words, rate of transcription at first promoter influences rate of transcription at second promoter. This mechanism is extensively studied in lytic-lysogenic differentiation of bacterophage lambda. In phages, tandem/convergent arrangement of lytic/lysogenic promoters is shown to exhibit gene regulation by means of transcriptional interference [2]. Although TI is known to occur in other bacteriophages (like 186) and bacteria, the exact mechanism is not known. To understand how TI occurs at the molecular level, Sneppen et. al [3] proposed a mathematical model of TI. In their model, three possible mechanisms of TI are considered.
a. Removal of Sitting duck:
RNA-polymerase along with sigma factor and other associated proteins that bind to DNA at the promoter site are collectively called as ‘pre-initiation complex’. In mathematical model of Sneppen et. al and in this report, ‘Pre-initiation complex’ is referred as ‘Sitting duck’. It is proposed that a polymerase coming from opposite direction can knock out (one or more) proteins in Pre-initiation complex causing reduction in number of transcripts formed from a promoter.
b. Occlusion:
Polymerase moving from first promoter towards second promoter can obstruct the formation of ‘Pre-Initiation complex’ at second promoter by blocking the promoter region. This mechanism of TI is termed as Occlusion.
c. Collision:
Two polymerases travelling from opposite directions can collide and can drop off the DNA. This is termed as Collision. It should be noted that there is no experimental evidence to support these three mechanisms. However, inclusion of these mechanisms creates a basis for mathematical consideration of TI.
2. Description of computer program
I developed a program to simulate Transcription (and Transcriptional Interference) using mathematical considerations developed by Sneppen et. al. The following parameters are taken into account for the simulation.
a. Constants:
- Distance between two convergent promoters pL and pR (62 bp)
- Velocity of polymerase (40 bases per second)
- Size of promoter (70 bp) and position (-50 to +20)
- Length of polymerase (35 bp)
- Length of Sitting duck (70 bp) and position (-50 to +20)
- Distance between Promoter and Termination point (35 bp)
- Total Simulation time (5 hours)
b. Variables:
- Intrinsic strength of promoter: It is the Rate of transcription (Number of transcripts per second) from an Un-inhibited promoter.
- Aspect ratio of the promoter: It is the ratio of Rate of binding and Rate of firing from a promoter. Rate of binding and Rate of firing are dependent variables derived from intrinsic strength and aspect ratio.
c. Data Structures
DNA is encoded as a string of 0’s. Promoter and Termination sites are pre-marked as positions on DNA string. A string with all ZEROS is a DNA without any polymerases. String with 1 and 2’s means DNA with Sitting ducks located at left and right promoters respectively. Polymerase movements for each promoter are captured by making a list of the each polymerase’s end point on DNA string and updating the list as polymerase moves. A ‘Queue’ data structure (FIFO - First In First Out) using PERL’s ‘UNSHIFT’ and ‘POP’ functions is used for updating polymerase positions.
d. Simulation
Transcription events are captured at 1 second intervals. Polymerase binding and firing rates are converted into probability functions and a random number generator is used to determine the probability of an event happening. In one second, a polymerase can bind to a DNA at a probability P1. A bound polymerase (aka Sitting duck or Pre-Initiation complex) can fire at a probability P2. A fired polymerase can move 40 bp per second. The likelihood of these events happening is also dependent on the three Transcriptional interference mechanisms described above (Sitting duck removal, Occlusion and Collision). If a polymerase reaches the termination point, it is counted as a successful transcription. Number of transcripts produced from a promoter with and without interfering mechanisms is calculated. Average number of successful transcriptions for 100 simulations is calculated for determining Interference value. Interference is defined as the ratio of Number of transcripts produced Without-interference and With-interference.
3. Results
a. Collisions are major contributing factors for interference. And occlusions, the least.
I performed three sets of simulations: 1) with only Collisions included 2) with only ‘Sitting duck removal’ included and 3) with only Occlusions included. Consistently, Collisions cause more interference than Sitting ducks and Occlusions. While Occlusions cause least interference.
This first observation confirmed intuitive reasoning. Occlusion is an event that happens at the level of polymerase binding; Sitting duck removal at the level of polymerase firing; and Collision at the level of polymerase movement. It takes longer time to replace a polymerase lost at the ‘movement-stage’ of transcription (i.e. lost by Collision) than the polymerase lost at the ‘bindingstage of transcription (i.e. Occlusion), because a polymerase spends more time to reach ‘Collision site’ (a collision site can be anywhere between a promoter site and a termination site) and least time to reach ‘Occlusion site’ (Occlusion site is always the promoter site). Since Sitting duck removal event happens in-between Occlusion and Collision, this event has intermediate effect on interference.
b. Intrinsic strength of opposing promoter is the most important parameter that determines extent of interference.
I modelled Transcriptional interference between two converging Promoters pE and pL. pE is derived from bacteriophage 186. It is a strong promoter with intrinsic strength of 0.028 transcripts per second (experimentally calculated value). In the model, this promoter is placed on Left hand side. pL is a weak promoter with intrinsic strength of 0.0056 transcripts per second derived from bacterophage p2. In the model, this promoter is placed on right hand side of DNA.
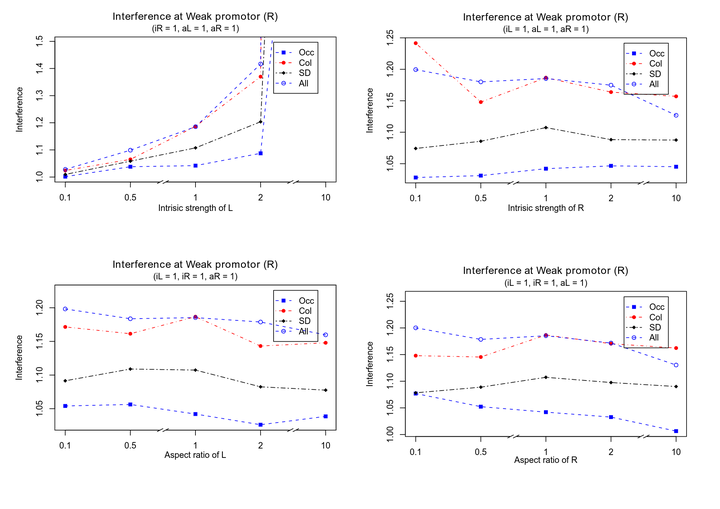
In figure, Interference at right side promoter (R) is plotted as a function of one of the following four parameters: 1) Intrinsic strength of Left side promoter (iL) 2) Intrinsic strength of Right side promoter (iR) 3) Aspect ratio of Left side promoter (aL) and 4) Aspect ratio of Right side promoter (aR).
As expected, interference at Right side promoter increases with increase in intrinsic strength of Left side promoter. Since Left side promoter is 50 times stronger than right side promoter, it has more power to disrupt transcription. Accordingly, interference values remain flat for increase in iR, aL and aR because interference is dominated by iL.
Outlook
The predicted interference value of 1.2 is less than experimentally determined interference (~3.0) between pE and pL. I haven’t figured out the reason for this difference yet. Also, I haven’t tested the effect of varying inter-promoter distance. Studies by Sneppen et. al has interesting observations on varying inter-promoter distance. I plan to look into this in future.
References
- Benjamin P. Callen, Keith E. Shearwin and J. Barry Egan, Molecular Cell (2004) Vol. 14, 647–656.
- Adam C. Palmer, Alexandra Ahlgren-Berg, J. Barry Egan, Ian B. Dodd, and Keith E. Shearwin, Molecular Cell (2009) 34, 545–555.
- Kim Sneppen, Ian B. Dodd, Keith E. Shearwin, Adam C. Palmer, Rachel A. Schubert, Benjamin P. Callen and J. Barry Egan, J. Mol. Biol. (2005) 346, 399–409